
AgileData Activity Event Tile, AgileData Engineering Pattern #6
The Activity Event Tile pattern tracks a sequence of events (e.g., subscription signups, subscription payments) for a core business concept by storing minimal event data.
Automated Load Patterns based on Source Data Profiles
Quicklinks
Agile Data Engineering Pattern
An AgileData Engineering Pattern is a repeatable, proven approach for solving a common data engineering challenge in a simple, consistent, and scalable way, designed to reduce rework, speed up delivery, and embed quality by default.
Pattern Description
The Activity Event Tile pattern tracks a sequence of events (e.g., subscription signups, subscription payments) for a core business concept by storing minimal event data and using a hydration layer to automatically generate pre-calculated metrics as views.
This allows business users and analysts to easily understand business performance and event sequencing without complex SQL, providing immediate, consistent insights into activity movements and financial impacts
Pattern Context Diagram
Pattern Template
Pattern Name
AgileData Activity Event Tile
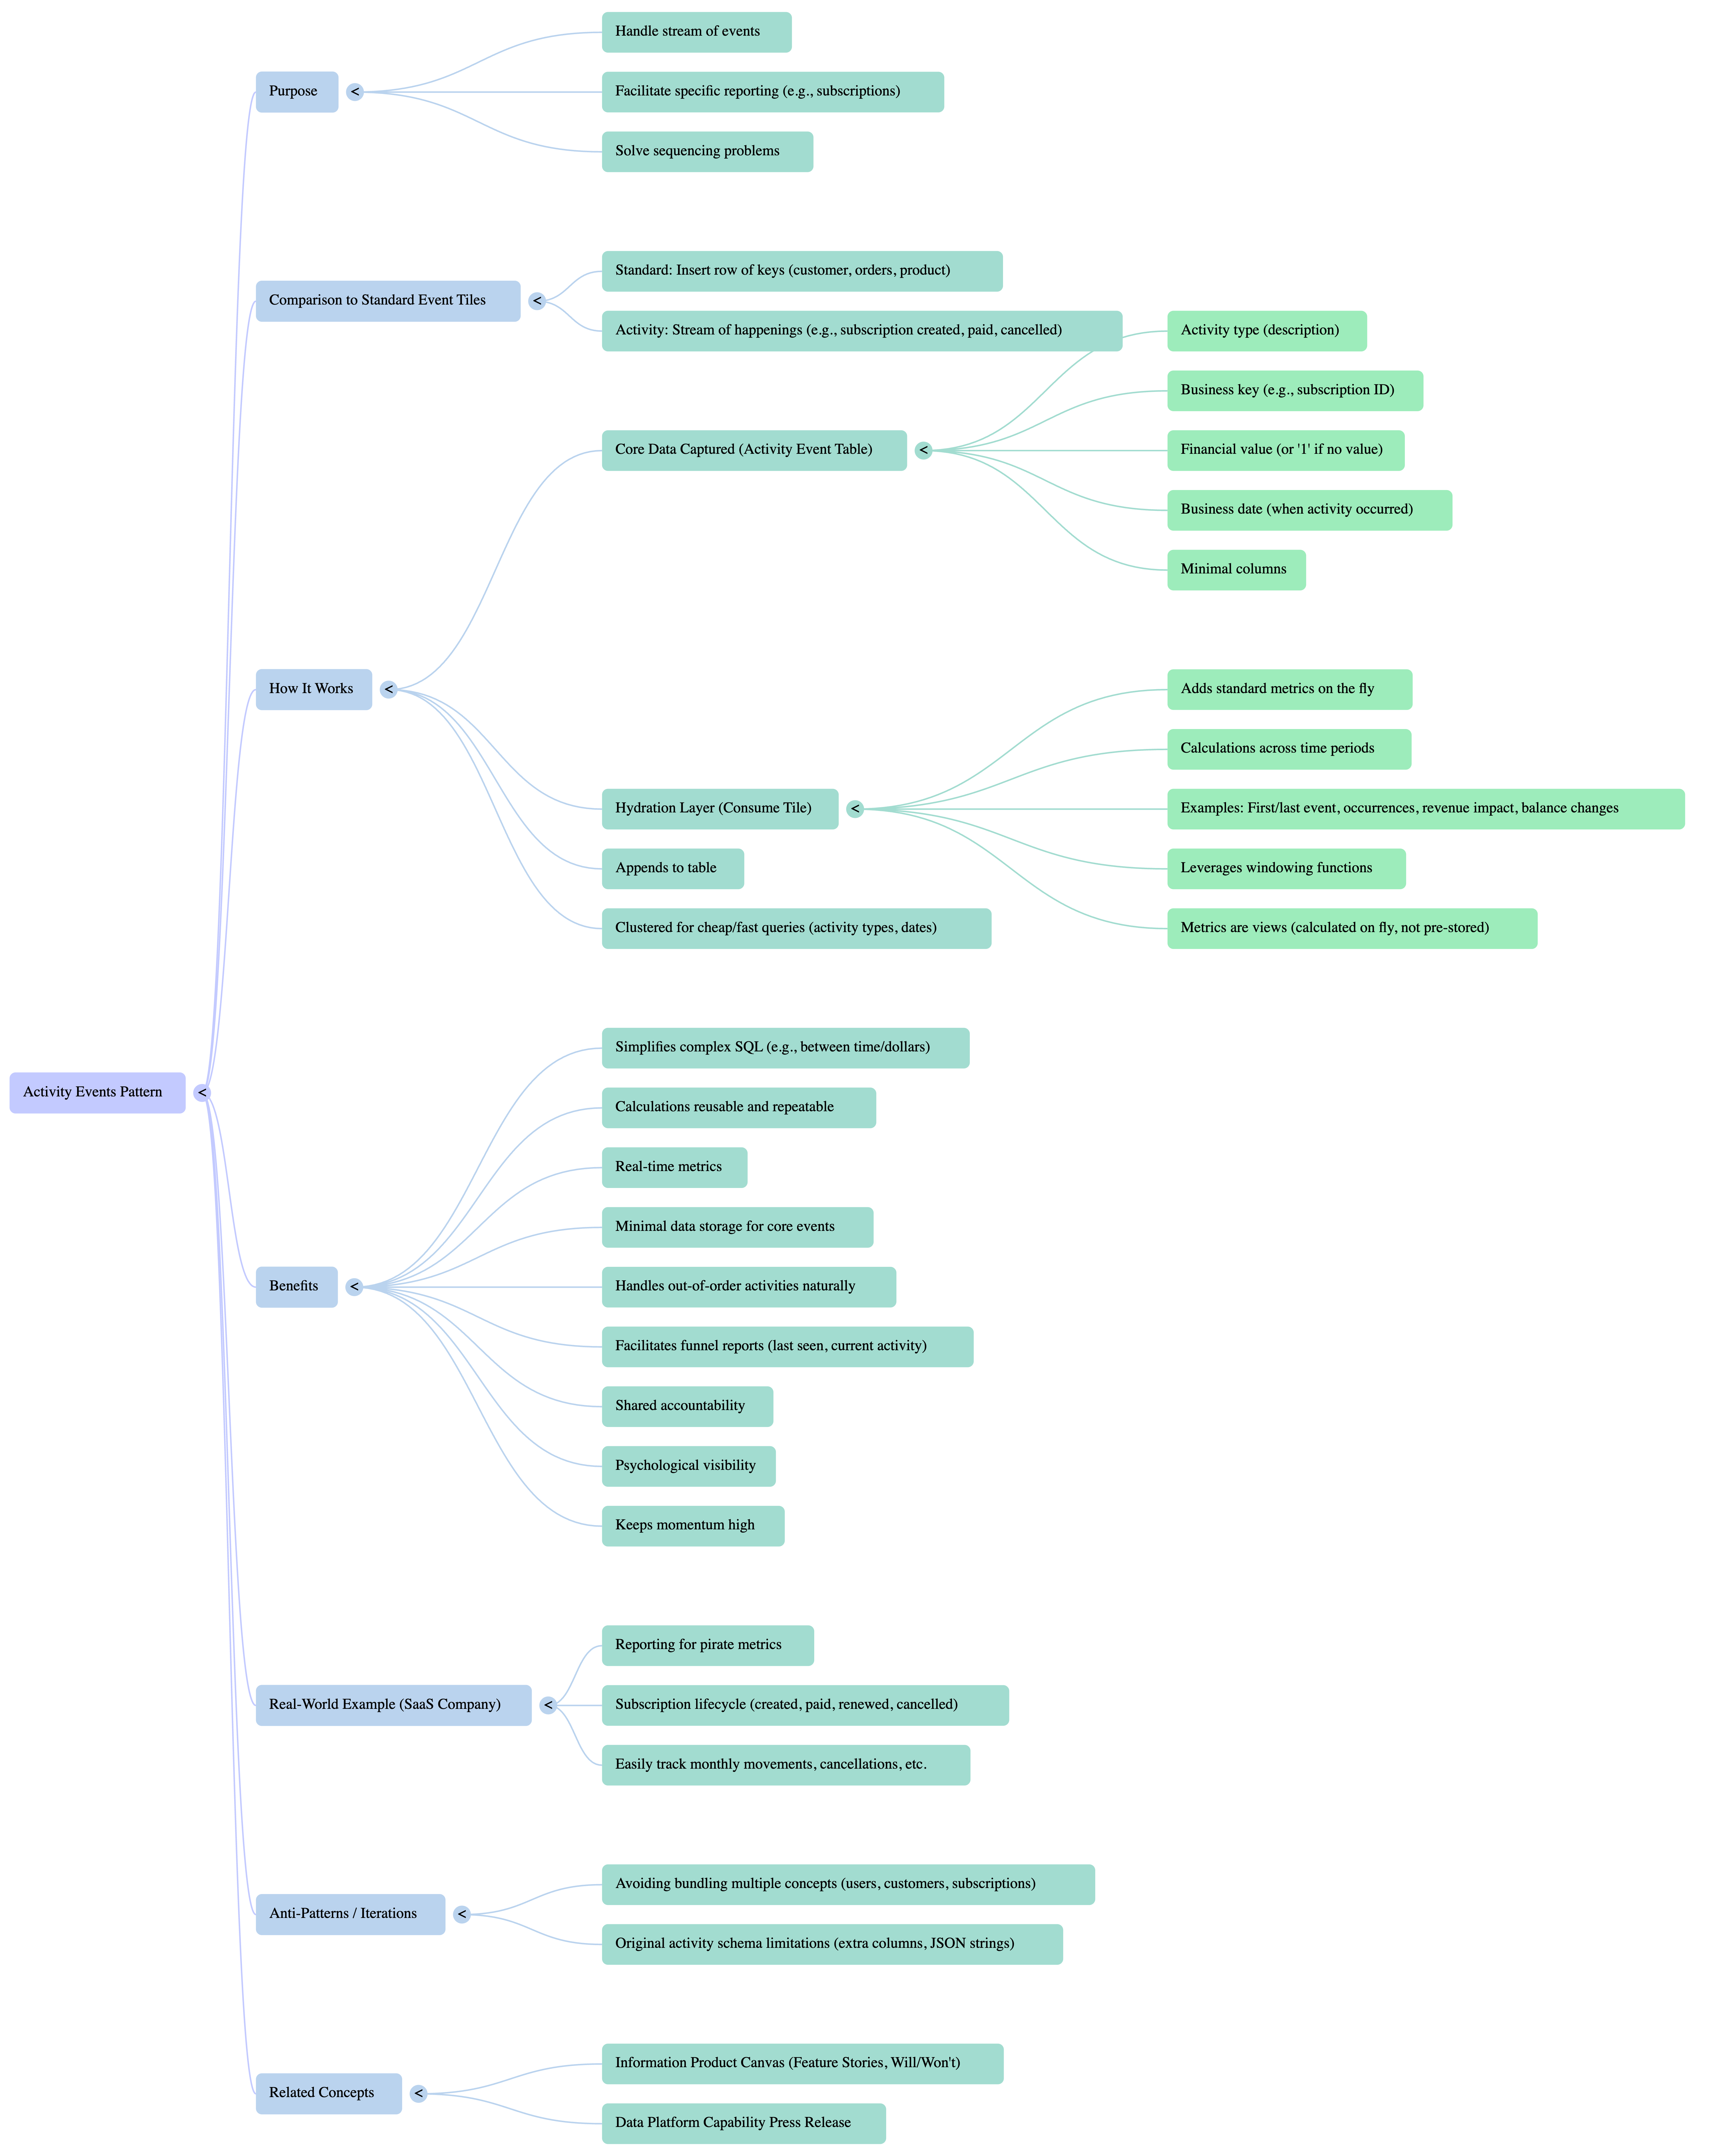
The Problem It Solves
You know that moment when you're trying to analyse a sequence of related business events, like customer subscriptions changing over time, and you need to answer questions about trends, movements, or financial impacts?.
Typically, this involves writing "really horrible SQL" with complex "windowing functions" to connect these events and calculate metrics like 'time between' or 'dollar changes'.
The problem is, these manual calculations are often "not repeatable or reusable in other reports," leading to inefficiency and inconsistent insights. Furthermore, dealing with activities that happen out of expected sequence can be a significant challenge without this pattern
When to Use It
Use this pattern when:
Track a sequence of events related to a single, core business concept, such as subscriptions.
Derive time-based metrics and comparisons (e.g., changes between months, opening/closing balances, first/last occurrences).
Easily understand the financial impact or count of specific activities over time.
Simplify complex reporting that traditionally requires extensive SQL "windowing functions" or "slamming events together".
Handle and identify activities that occur out of expected sequence (e.g., a subscription going from "cancelled" to "paid") without hardcoding sequencing logic.
Provide repeatable and reusable calculations for your "last mile tool" or reporting layer
How It Works
This pattern provides a structured and automated way to manage and report on a sequence of activities.
Trigger:
A relevant activity occurs for a core business concept (e.g., a subscription is created, paid, renewed, or cancelled).
Inputs:
A business key that identifies the core concept (e.g., the subscription ID).
A clear description of the activity itself (e.g., "subscription created," "subscription paid").
A financial value associated with the activity (e.g., the payment amount) or a simple '1' if it's a non-financial occurrence.
The business date when the activity occurred
Steps:
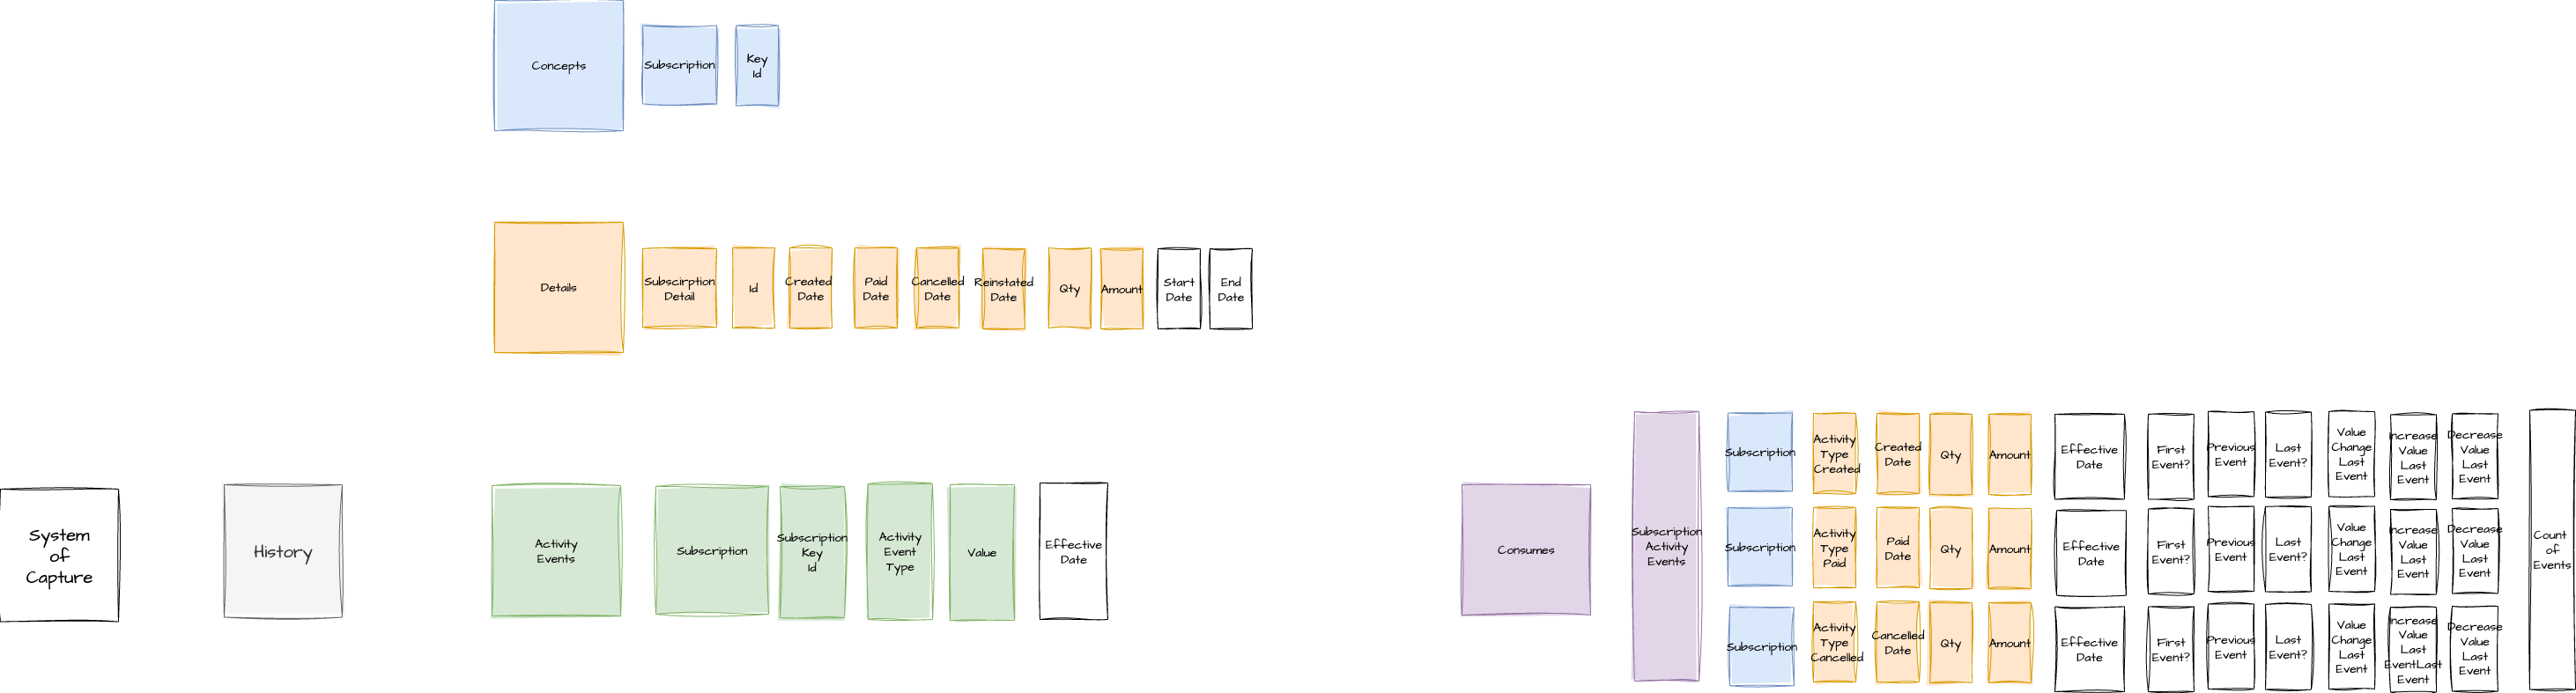
For each activity, a minimal record is created containing only the business key, activity description, value, and date.
These records are appended to a dedicated "activity event table". This table is intentionally "tiny".
The "magic happens in the hydration layer".
A "consume tile" is automatically generated. This tile includes a list of standard metrics that are calculated "on the fly" as views. These metrics automatically provide insights such as:
Is this the first or last event seen for that concept?
How many occurrences have been seen?
What is the revenue impact or value change compared to previous activities?
What are the opening and closing balances over time?
What was the previous activity for every record?
Outputs:
A highly efficient, append-only activity event table that can hold "squillions of records" with minimal storage.
A "consume tile" that acts as a ready-to-use Data Asset, providing pre-calculated, real-time metrics and views.
The ability to directly plug this data into "last mile tools" for immediate and intuitive reporting on business health metrics, such as subscription performance.
Why It Works
It's like having a dedicated, intelligent accountant for every ongoing business item, automatically calculating its dynamic financial and state changes. This pattern works because it:
Automates complex calculations: It handles the "horrible SQL" and "windowing functions" that are typically required to analyse event sequences and calculate movements or changes, making these complex tasks simple for end-users.
Provides real-time, non-stale metrics: By generating calculations as views "on the fly," the metrics always reflect the latest reality from the activity feed, preventing stale data issues.
Enables easy trend analysis: It allows businesses to effortlessly answer questions about "movement between months" or "total value of cancellations" by simply dragging pre-calculated columns onto a report.
Efficiently stores data: The core activity event table is "tiny" and contains only essential keys, values, and dates, making it very performant and cheap to store vast amounts of event data.
Optimises query performance: Clustering the table based on activity types and dates ensures that queries for calculations are "fast and cheap".
Simplifies sequencing and anomaly detection: By tracking every activity and its predecessor, it inherently handles activities happening out of normal order, making it "really easy to pull out" anomalies like a subscription going from "cancelled to paid". It also simplifies creating "funnel reports" by providing current and last seen activities
Real-World Example
Consider a Software as a Service (SaaS) company that needs to monitor key business metrics, often referred to as "pirate metrics," which track user acquisition, activation, retention, revenue, and referral.
Before adopting the Activity Event Tile pattern, an analyst might manually track events like "subscription created," "subscription paid," "subscription renewed," and "subscription cancelled" in a standard event table. To determine things like the net change in subscriptions month-over-month, the value of cancelled subscriptions in a given period, or the time elapsed between different subscription states, they would have to write highly intricate and time-consuming SQL queries involving multiple joins and complex window functions. These queries would often be specific to one report and difficult to reuse.
With the Activity Event Tile pattern, the company's data platform automatically records each subscription activity with its business key, type, value, and date. The pattern then generates a consumable data tile that exposes columns such as "subscriptions created this month versus last month," "total value of cancellations this month," or even the "previous activity" for each subscription.
Now, the analyst can simply drag and drop these pre-calculated columns into their reporting tool (their "last mile tool"), and the backend automatically performs the complex calculations, providing immediate and reliable insights into the health of their subscription business
Anti-Patterns or Gotchas
Bundling Unrelated Concepts: A major pitfall is trying to include multiple, distinct core concepts (e.g., users, customers, and subscriptions) within the same activity event tile. This makes reporting "skewed" because these are separate activities, even if related, and keying them together becomes "problematic." This pattern works best when focused on a single, binding core concept.
The original "activity schema patterns" that attempted to manage addiotnal related Core Business Concepts this with extra columns or JSON stringing doesn’t solve this problem at scale.
Hardcoding Activity Sequencing: Don't attempt to hardcode the expected sequence of activities. This pattern naturally reveals when activities happen out of normal order, providing valuable insights rather than breaking the system.
Pre-storing All Metric Combinations: Avoid the temptation to pre-store every possible combination of every metric. The pattern relies on calculations as views, which ensures metrics are always real-time and avoids persisting "stale value[s]"
Tips for Adoption
Understand its Specialised Use: Recognise that this is "a slightly different Pattern" compared to standard event tiles, designed specifically for tracking streams of activity for a core concept.
Keep the Activity Table Minimal: Ensure the underlying activity event table stores only the bare essentials: the business key, activity type, associated value, and the event date. This keeps it "tiny" and highly performant.
Leverage Clustering: Cluster your activity event table on fields like activity types and dates. This significantly improves query speed and cost-effectiveness for the automated calculations.
Focus on a Single Core Concept: When designing an activity event tile, ensure it revolves around one central business concept (e.g., subscriptions). Resist the urge to combine unrelated concepts into the same tile.
Trust the Hydration Layer: Rely on the pattern's "hydration layer" to automatically generate the complex, real-time metrics and views, rather than trying to pre-calculate everything manually
Related Patterns
Standard Event Tiles: This pattern is a variation of the AgileData Event Tile. Event Tiles typically record "a row of keys into the event table like customer, orders, product" at a specific "point in time" for reporting. The Activity Event Tile extends this to handle sequences of events and time-series analysis more effectively.
Press Release Template
Capability Name
Activity Event Tile Data Modeling
Headline
New Activity Event Tile Delivers Easy-to-Understand Business Insights from Complex Sequences of Events for Analysts and Business Users
Introduction
Today, we're excited to announce the launch of our new Activity Event Tile capability. This powerful feature is designed to transform how businesses track and analyse sequences of events related to a core concept, such as customer subscriptions or product usage. It provides automated metrics and views, making it incredibly simple for business analysts and users to gain deep, consistent insights into dynamic business performance without needing to write complex code
Problem
"As a business analyst, I used to dread trying to track changes in our subscriptions and derive meaningful insights. I had to write really horrible SQL with complex windowing functions just to connect events and calculate things like 'time between' activities or 'dollar changes'. The worst part was, those calculations were often not repeatable or reusable in other reports, which meant I was constantly reinventing the wheel and couldn't rely on consistent data."
Solution
The Activity Event Tile solves this by creating a highly efficient, append-only table that records minimal data for each activity – just the business key, a clear description of the activity, an associated financial value (or a simple '1' if non-financial), and the business date. The true power lies in its "hydration layer", which automatically generates a "consume tile" with a comprehensive list of standard metrics calculated "on the fly" as views.
This means users can now easily answer questions like "how many new subscriptions did I get this month compared to last year?" or "what's the total value of cancellations this month?" by simply dragging these pre-calculated columns onto their reports. It also inherently handles activities that happen out of expected sequence, providing insights into anomalies without hardcoding sequencing logic. This capability eliminates the need for complex manual SQL, providing real-time, non-stale insights directly in your reporting tools.
Data Platform Product Manager
"With the Activity Event Tile, we've transformed complex, bespoke reporting into a repeatable, auditable, and highly performant capability. Our data platform now consistently delivers quick business insights from multiple events, dramatically improving reusability and building greater trust in our data assets across the organisation."
Data Platform User
"It's incredible! Now, I can just drag and drop pre-calculated metrics like 'total value of cancellations this month' or 'movement between months' directly onto my reports. I get instant, reliable answers to my key business questions, without wrestling with complicated SQL or worrying about stale data – it's completely changed how I track our business health!"
Get Started
The Activity Event Tile capability is available today. Simply look for the new "consume tile" in your last mile tool, which exposes all the pre-calculated metrics. For more detailed information or to discuss specific use cases, please contact your data platform product manager.
AgileData App / Platform Example
AgileData Podcast Episode
https://podcast.agiledata.io/e/activity-event-tile-agiledata-engineering-pattern-6-episode-72/
AgileData Podcast Episode MindMap
AgileData Podcast Episode Transcript
Shane: Welcome to the Agile Data Podcast. I'm Shane Gibson.
Nigel: And I'm Nigel Vining.
Shane: Hey, Nigel. Onto the next Agile Data Engineering Patterns episode. This time we're gonna talk about activity events. For anybody listening, if you haven't listened to the previous episode of Data Engineering Patterns, where we talked about our event tiles, I suggest you go and listen to that first, because we're gonna assume you listened and understood that before we move on to this one.
So activity events, it's a slightly different Pattern that we use for our event tiles compared to our standard Pattern. So module, why don't you explain to me what it is and why I care.
Nigel: Sure. So the previous one we talked about events where we basically. Insert a row of keys into our event table, like customer orders, product.
And that's cool because those three things are lined up at a point in time and we report on those. The activity events are a little bit different because effectively it's like a stream of things happening that we care about. Subscription is a really good example of where. Because we've got this, basically a whole lot of events come in where subscriptions are created, subscriptions are paid, subscriptions are renewed, subscriptions are canceled, and generally the type of.
Reporting that businesses do around subscriptions is, how many new subscriptions did I get this month compared to last year? And my number of subscriptions going up or going down, is the amount of revenue from my subscription static increasing, decreasing? So there's all these really useful questions that the activity schema can answer.
So the difference with our rule template for activities, they're really simple. All we capture is what the activity is, the business key. Subscription in this case. Basically a nice clear description. Like I said, subscription created, subscription paid, subscription canceled. We effectively describe what it is.
We also assign the. Financial value to each activity. Some activities don't lend themselves to a value. It may literally be a one that something happened compared to a dollar amount where a subscription payment is received, and that's where we would have that amount. So we can track those over time. And of course, the effectively the business data of when this activity.
It's really quite simple. We just create those and we just keep appending them into that table. The magic happens in the hydration layer, so where you take that list of keys attached to activities and we hydrate them into a. Tile and at the same time we include a list of standard metrics into that view that we calculate on the fly.
'cause we're looking across time periods of data, so we automatically have things like, is this the first subscription created event we've seen? Is this the last subscription created event we've seen? How many occurrences of subscription created have we seen? Are they repeated? What is the revenue impact of this?
Subscription paid activity, is the value going up or is the value going down when we effectively put it against the previous payment for that subscription? And what is that value change? What is the opening balance if we add up all the financial impact? Values. What's the opening balance of those over time?
What's the closing balance of those? Over time, although very simplistic, each of these has a relatively straightforward window and function, but we apply all those. Automatically on our activity data, so you don't care about it, you just throw your activities in and a consumer tile will turn up and all those metrics are there.
You can plug it straight to your last mile tool, and you are immediately reporting by the health of your business based on its
Shane: subscriptions. The key for this one is we were building out some reporting for software as a service company that needed to do all the pirate metrics and all that kind of stuff.
And what I was forced to do is create a bunch of events. So I'd say that a subscription was created, a subscription was paid, description was renewed, description was canceled using our standard event table, but then to be able to work out the between time or the between dollars for those events, I had to write really horrible sequel to slam those events together.
And then doing all those windowing functions. So what I ended up doing was slamming them all together and then doing all the window functions and calculations of the last. Which means that none of those calculations were repeatable or reusable in other reports. So by introducing this new Pattern, I can effectively now go pick that data up and I can say, what's the movement between months really easily?
How many subscriptions were traded this month versus last month? How many subscriptions were created three months ago and then canceled this month? What's the total value of cancellations this month? They're all really simple because I just drag, those calculations or those columns onto my report and.
The back end does all the heavy work. And so that's one of the things that is quite important. Those calculations are effectively views. So we're not pre storing every combination of every metric. It's each column is effectively being generated or calculated on the fly when I grab it into that last mile tool, correct?
Nigel: That is correct. Yep. 'cause we always. Want those metrics to reflect the reality in real time based on our last feed of subscriptions, because it's moving all the time and we're not moving historically, but we might be comparing to historic. So, but doing as a view, it really doesn't cost us a lot of extra and it makes sure we never persist a stale value.
Shane: The other thing is we are effectively storing. The idea of an event happening twice. 'cause we will still have the event in a standard event tile and then we are storing a another version of it effectively in the activity event tile. But the data is minimal because we're holding a very small number of columns that are effectively just holding keys or time or dollar values, correct.
Nigel: Yeah, the activity event table is tiny. It is literally the business key, what the activity was, the value associated with it, and when it happened, literally four or five columns, minimal. It's nothing. It's when we hydrate it and we go wide with the attributes and the metrics, but the actual activity table, we can put squillions of records in there and that's all good.
We cluster that one. Based on the activity types and the dates around that, because generally all of our calculations and metrics are all based around when something happened and what it was. So by clustering on those fields, it means that. The queries are actually very cheap 'cause we say we know where all the subscription created records are on the table and effectively all the dates are ordered within that.
So any of the calculations automatically based on cluster data. So it's fast and cheap.
Shane: The other thing that allows us to do is deal with those horrible, any sequencing problems. Subscriptions, created subscriptions, paid subscriptions, canceled subscriptions, renewed, right? It's reopened. The person's come back after six months and turn that subscription back on, and so we don't actually have to hard code the sequencing of the activities.
Because those activities come from the data. But what it means is we can see when activities happen out of the normal order we would've expected because they're turning up as something that happened that we didn't expect. And that's really important. But we get that for free because effectively an activity happens and activities inserted, and now I can see a state change for that subscription when it happened and what the dollar value, the impact of it was.
And that saves a lot of complex SQL querying. Last mile. You have to answer those type of questions.
Nigel: Yeah, because we keep track of what the previous activity is for every record, so we know if something's happened. We also give you the previous one for free because then you can say that they went from, as you said, canceled to paid.
That's an anomaly, and that's really easy to pull out because you shouldn't expect to see that.
Shane: But we. Show you that it's happened, which means if I want to create a funnel report, it's really simple because I have the last seen activity and the current activity and that's data. And therefore most of the reporting tools will be a pretty funnel report with very little need for me to do a whole lot of sequel gymnastics.
Absolutely. That's exactly what's happening. So what we've done though is we've iterated a version of activity schema modeling. Yes. So we've taken the bits that work for us, the idea of having a core concept that's. Finding as the core content for this activity event tiles, in this case subscription. The idea of having activity types and having a row every time we see a, an activity type happen for that subscription.
The idea of holding a date and a financial metric or value, which we need to report off the idea of. Precalculating or holding all those complex calculations of betweens and increases and decreases and last seen. But what we haven't done is gone to the next step, which is have the ability to hold multiple other concepts.
And that's because when we looked at the activity schema Pattern, it didn't deal with that particularly well. It was effectively an anti-patent that they pushed. And originally what it said was you had two extra columns and that kind of didn't work. Then they started Jason stringing all those other concepts in there.
So you put them in and unpassed them. And again, that didn't work for us. So what we took is the things that worked for us to solve that one particular problem. It's given us a whole lot of value for a bunch of other use cases, but we haven't picked up that last part of the Pattern because in our view.
Doesn't actually solve the problem that we need to solve for that use case.
Nigel: Yeah, bundling users, customers, subscriptions into the same activity doesn't make a lot of sense because effectively the reporting becomes a little bit skewed from it. 'cause they don't really go together. There are three activities that are happening side by side.
They're related, but to key them together is problematic.
Shane: Yeah. So we'll probably solve that another day, but not today. Alright, and on that note, I hope everybody has a simply magical day.